Elastic{ON}2017 レポートのまとめはこちら!!
Hi, Everyone.
This is Aung Satt from Acroquest.
Today, I attended to session called "What's X-citing in X-Pack" and there were six presenters presented X-Pack components, such as, Security, Alerting, Monitoring & Management, Reporting, Graph, etc... respectively.

Although, I waited for Machine Learning which was announced to be one component in X-Pack was not appeared in today X-Pack session.
I will summarize by each component as follow.
1. Management & Monitoring
Management will play a role which is not just for Kibana anymore, and which can be used for
- User Management (v5.0+)
- Role Management (v5.0+)
- Search Profiler (v5.1+); which is free with basic license.
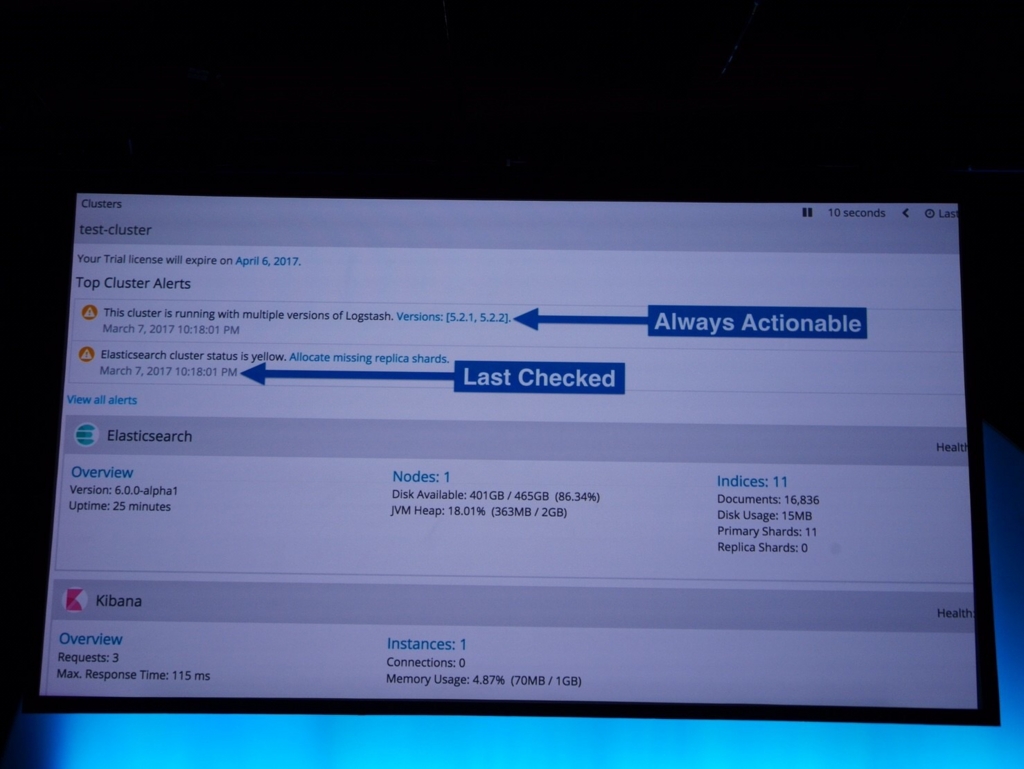
Moreover, Monitoring became being able to see overview of Logstash besides of Elasticsearch and Kibana in v5.2.
As revolutions for Monitoring.
- Cluster Alerts; Proactive, automatic notifications of problems from Watcher
- Logstash Pipeline Viewer; you can find bottlenecks in your Logstash nodes and plugins.
- Machine Learning Integration
- Beats integration
Noticeably changes are Alerts in Monitoring will be always actionable.

2. Security
To make more secure your clusters, Security will remove default password, "changeme" and no more passwords in configuration file and instead of that will single sign on with key authentication.

3. Reporting

Reporting will provides you, more layout options and besides supporting to you downloadable PDF, Reporting will allow you to export you visualization into CSV data.
4. Alerting
Alerting is not changed so much. It will be added Index action which can specify document id for alerting starts from X-Pack v5.3. And Alerting will be powered by Distributed Watch execution which can guarantee for watch execution happens on all nodes and will not do anyworkload on Master node.

Graph
Graph is pretty impressive for its improvement. As you may already know, Graph supports you to understand the relation between documents and Graph has been a stage to make alerts and visualizations on Kibana by just selecting a data node which will be showing in Graph according to your relation of Data.

This can make you to understand more about your data and easier to create reports.
And Graph seems to add new ways to describe your relation of data with Metric table and Swim Lane Table.

In today session, it was good to know the improvements and future possible approaches from x-pack for the value of customers and efficiency.
Be stay in tune, and I will be posting, newest information about ELK from ElasticOn 2017 events.
Thank you.
Elastic{ON}2017 レポートのまとめはこちら!!